The Hidden Tax on
Your Solar Panels.
Your Solar Panels Are Lying to You.
Right now, somewhere in Madhya Pradesh, a 3 kW rooftop system is generating 11 units a day. Its owner thinks that is normal. It is not. That same system should be producing over 13 units, and in some cases, over 15.
The difference? A thin, invisible film of dust that is silently stealing up to 64% of the energy your panels were built to deliver. We did not guess at this number. We measured it. Across 25 real rooftop installations. Over three months.
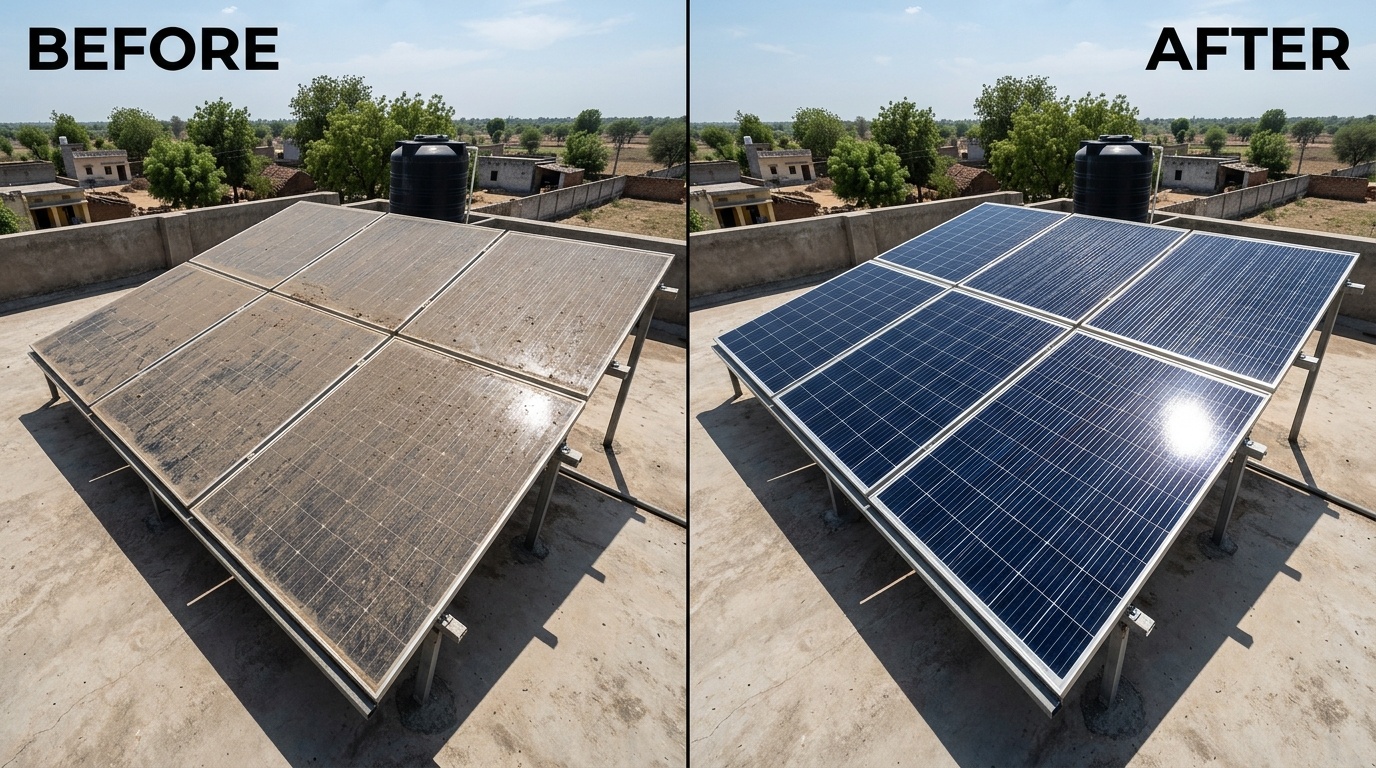
The same rooftop. Same panels. Same location. The only variable: one professional cleaning session.
The Study: 25 Rooftops, One Question
Between December 2025 and March 2026, r-solar's Squad team conducted a controlled field study across 25 residential solar installations in Barwani, Anjad, and Khargone.
The question was simple: How much generation are homeowners losing to dust?
Study Parameters
The Results
92% of systems showed immediate improvement after a single cleaning. Not over weeks, not gradually. The very next day.
of solar systems showed immediate improvement after one cleaning.
That is 23 out of 25 installations. Systems the owners thought were working fine. Systems generating what owners assumed was "normal" output.
Dust is not dramatic. It does not trigger an alarm. It does not show up on your monitoring app as a red flag. It just quietly shaves 20–60% off your generation, month after month.
Daily generation (units/day) before and after a single professional cleaning. The 6 kW system's dramatic recovery was the most extreme case recorded.
What Does This Mean in Rupees?
Units are numbers. Money is real. Here is the annual cost of not cleaning your panels, every year, quietly draining your solar investment.
"You would not ignore a ₹50,000 leak in your roof. Why ignore one on it?"
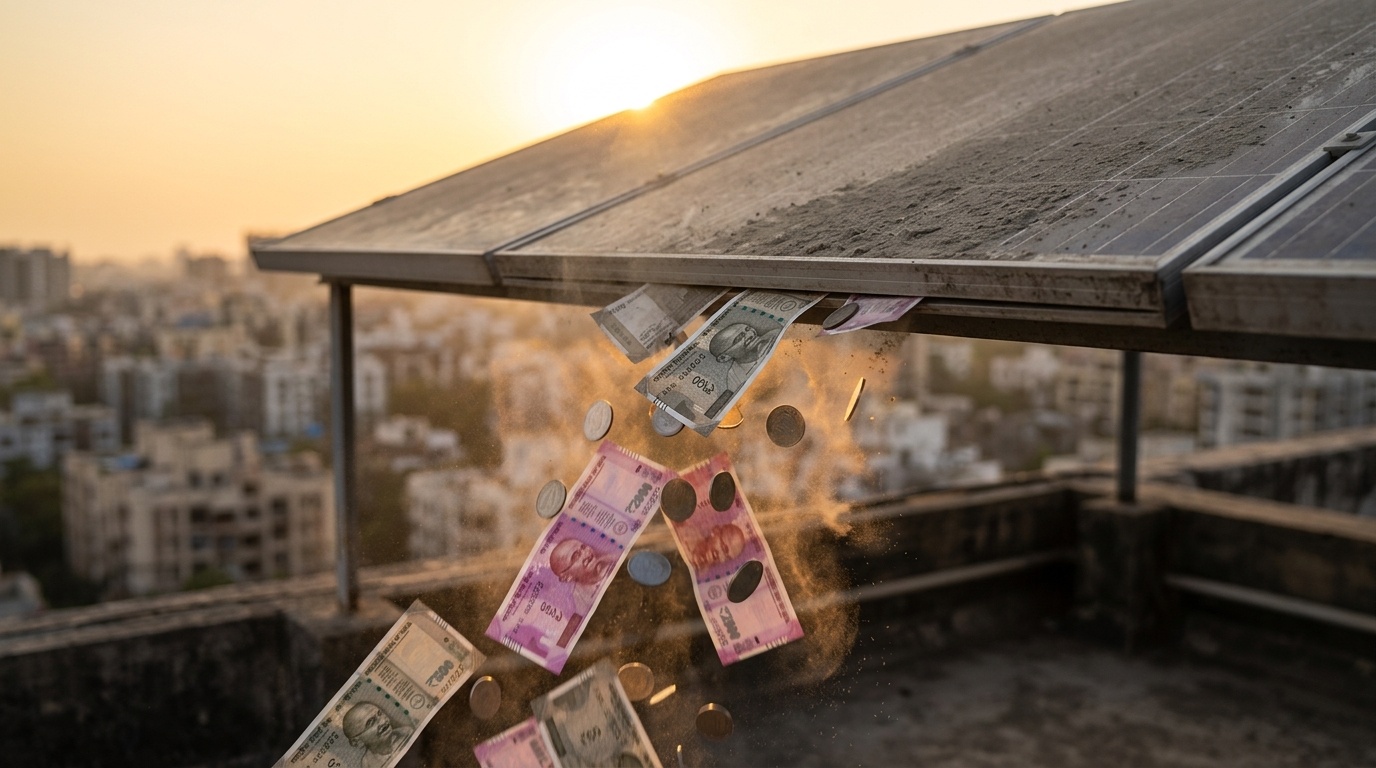
Every month your panels stay dirty, this is what happens to your savings.
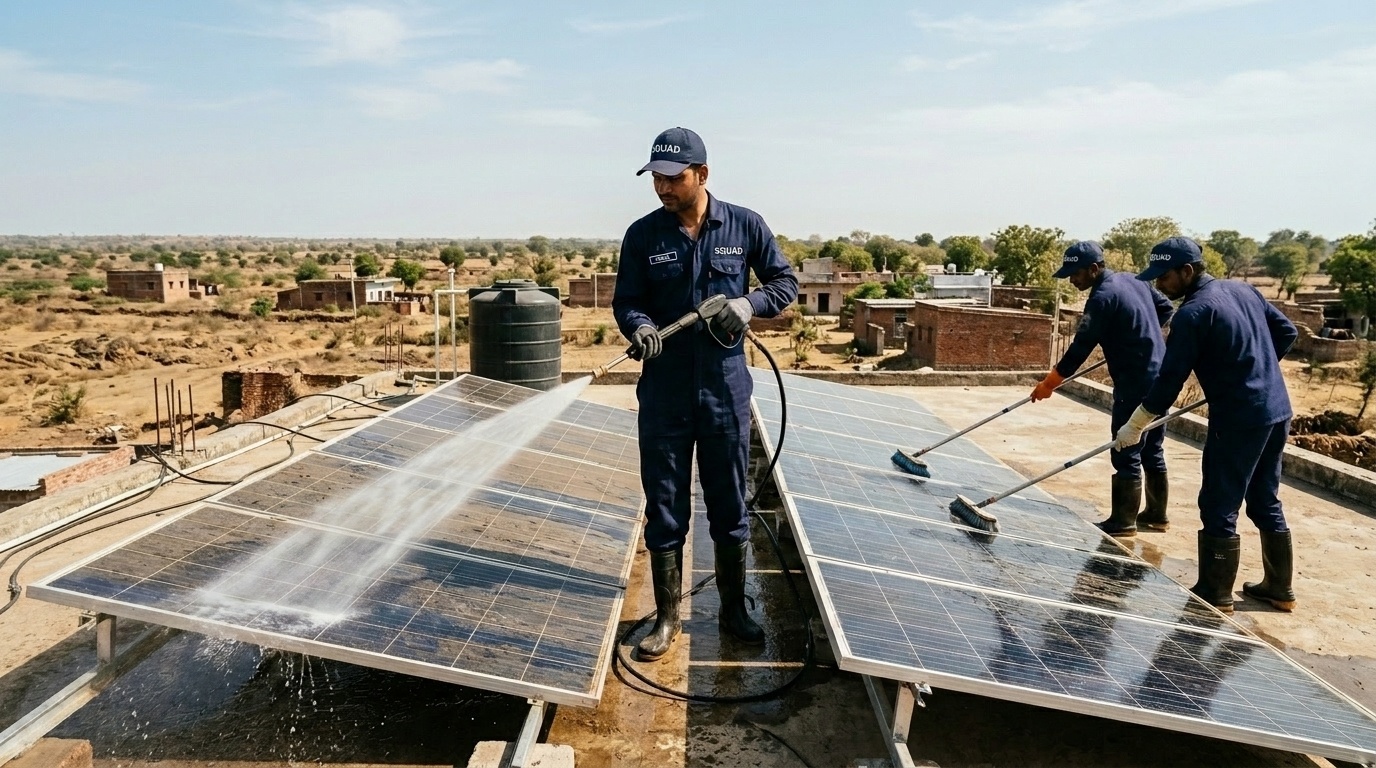
r-solar's 3-person Squad team at work. Standardised protocol, calibrated equipment, no harsh chemicals.
The Cleaning Process
Each installation was cleaned by a 3-person Squad team using a standardised 5-step protocol.
| System Size | Team | Time On Site |
|---|---|---|
| 3 kW | 3 persons | 25–30 minutes |
| 5 kW | 3 persons | 35–40 minutes |
| 6 kW | 3 persons | 45–60 minutes |
The Real Stories Behind the Data
Three installations. Three wake-up calls.
The Wake-Up Call
3 kW system · Barwani region
The owner had assumed the system was "not that powerful." It was. It was suffocating under dust.
The Invisible Drain
3 kW system · Khargone region
Output was "respectable, but underwhelming." The panels had never been cleaned since installation months earlier.
The Extreme Case
6 kW system · Anjad region
This 6 kW system was producing less than a dirty 3 kW system. After one cleaning: near-rated output. The system was never broken. It was buried.
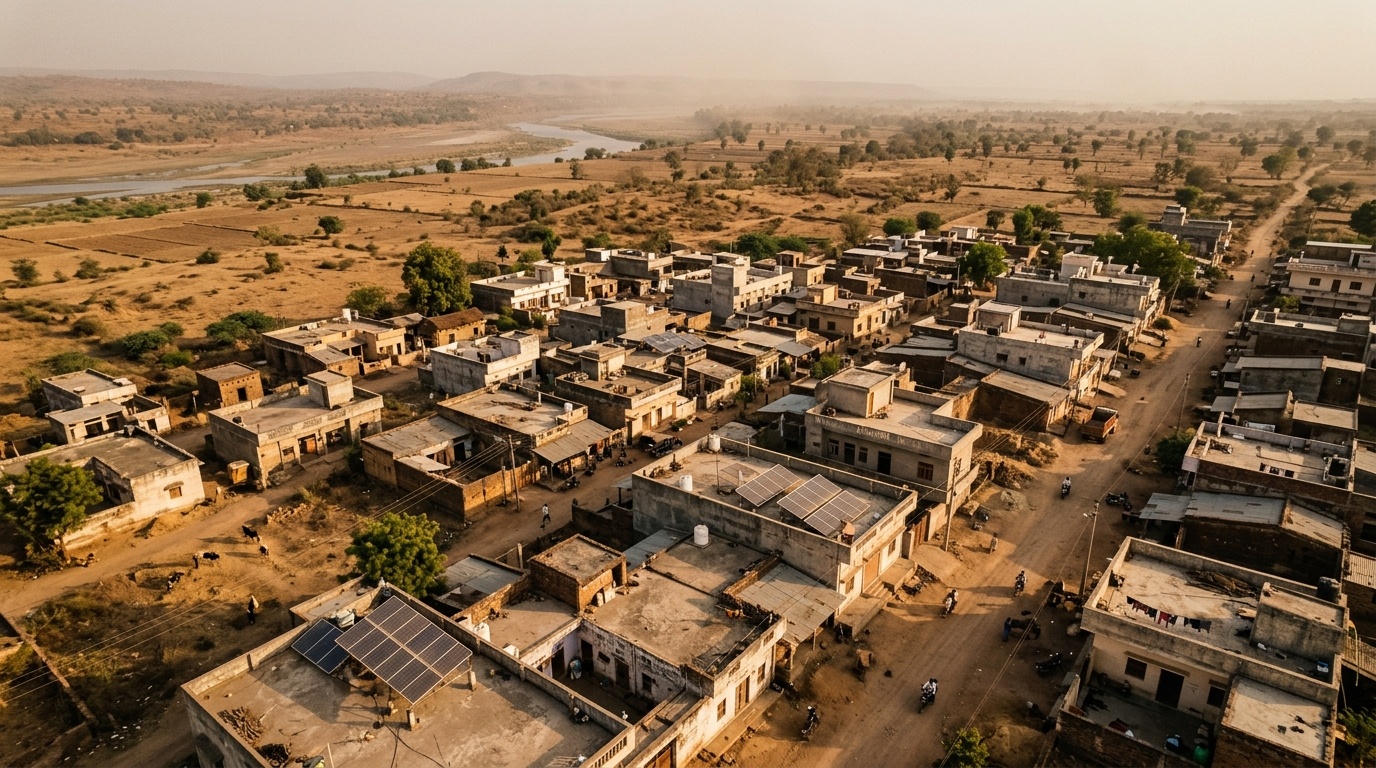
Semi-arid terrain, agricultural activity, and long dry seasons make MP one of the hardest environments for solar panels to stay clean.
Why Madhya Pradesh Is Especially Vulnerable
Dust degradation is a problem everywhere, but the severity in MP is extreme. Systems that would lose 10% efficiency in a coastal city can lose 30–60% here.
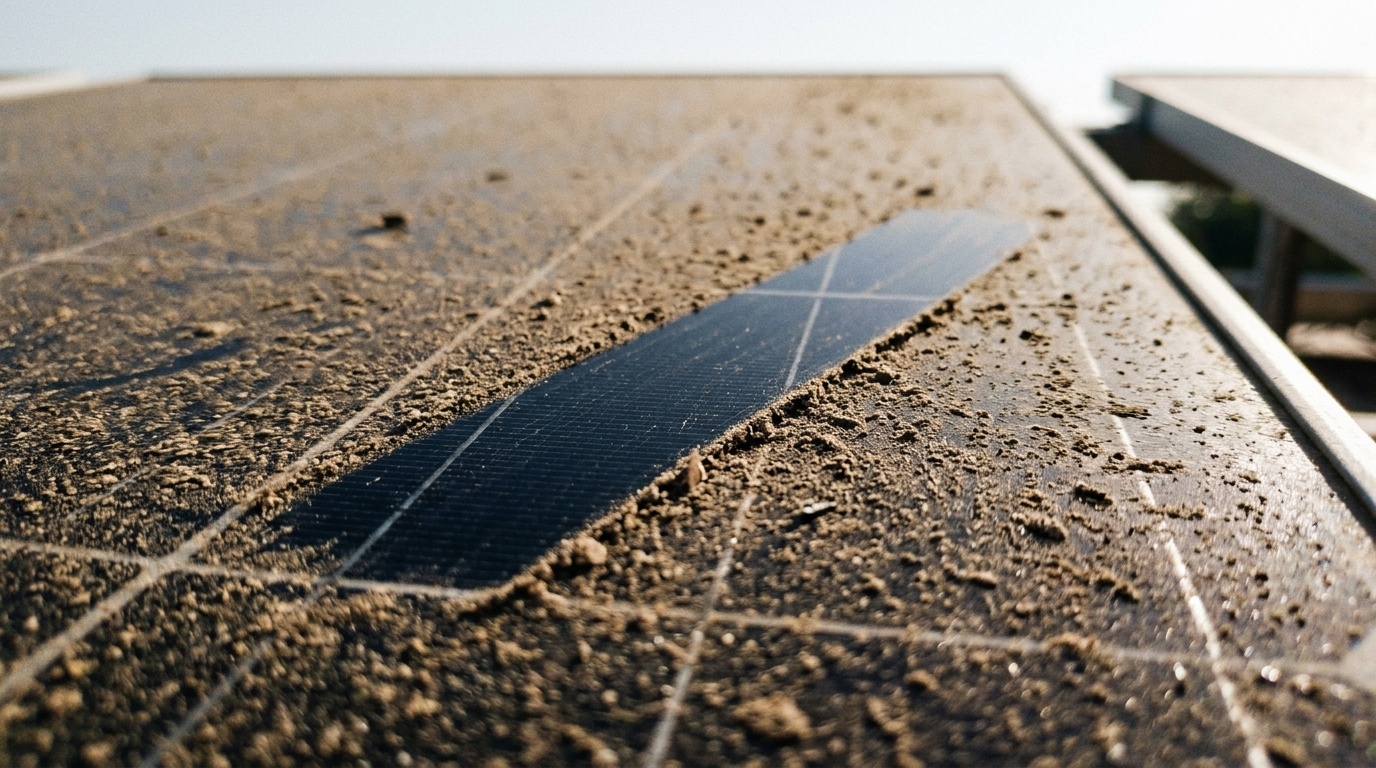
Extreme close-up of a panel in the field study. A single finger-swipe reveals the pristine surface hiding beneath the dust layer. This is what your panels look like after 3 months in MP.
The Bottom Line
Complete findings from the 25-installation field study.
| Metric | Finding |
|---|---|
| Sites studied | 25 residential installations |
| Systems showing improvement after cleaning | 92% (23 of 25) |
| Average efficiency gain, 3 kW systems | ~19% |
| Average efficiency gain, 5 kW systems | ~31% |
| Maximum efficiency gain recorded | 263% (6 kW system, Anjad) |
| Average daily generation recovered, 3 kW | +2.15 units/day |
| Average daily generation recovered, 5 kW | +5.13 units/day |
| Estimated annual savings from cleaning, 3 kW | ₹5,500 – ₹6,000 |
| Estimated annual savings from cleaning, 5 kW | ₹13,000 – ₹14,000 |
| Worst-case annual loss if uncleaned | ₹50,000+ |
| Cleaning time, 3 kW system | 25–30 minutes |
| Cleaning team size | 3 persons (1 technician + 2 labourers) |
| Monitoring system | PV Hub |
| Study period | December 2025 – March 2026 |
25 minutes of cleaning. Up to 64% more power. Thousands of rupees recovered every year.
What Are Your Panels Really Capable Of?
If your system has not been professionally cleaned in the last 3 months, you are almost certainly leaving money on your roof. Book an r-solar Squad cleaning and performance audit. We will show you exactly how much generation you are recovering, with real data, from your system, before and after.
Book Squad Cleaning Audit Calculate My SavingsOr WhatsApp us "CLEAN" to schedule your first session.
Study Details
Conducted by: r-solar Squad Team, Atvian r-solar Energy Private Limited
Region: Barwani, Anjad, Khargone, Madhya Pradesh
Period: December 2025 – March 2026
Monitoring System: PV Hub
Sample Size: 25 residential installations (3 kW, 5 kW, 6 kW)
Methodology: 5-day pre/post comparison with weather normalisation
Frequently Asked Questions
How often should solar panels be cleaned in India?
For most Indian cities, professional cleaning every 2-3 months keeps generation within 5% of peak. Dusty regions like Madhya Pradesh, Rajasthan, and Delhi-NCR benefit from monthly cleaning during dry season (October to June). Coastal areas need cleaning less frequently due to natural rain washing. Our 25-rooftop study in MP found systems left uncleaned for 6+ months were generating 18-25% less power than rated capacity.
Does dust really reduce solar panel output that much?
Yes, and far more than most homeowners realise. Our field measurements across 25 MP rooftops showed dust accumulation reduced generation by 15-25% within 60 days during dry months. For a 3 kW residential system in MP, that translates to 60-80 lost units per month, or ₹400-₹600 in electricity savings forgone. The economic impact of skipping cleaning typically exceeds the cleaning cost by 4-8x annually.
Can rainwater clean solar panels effectively?
Partially, but unreliably. Rain rinses surface dust but leaves mineral deposits, bird droppings, and adhered particles that build up over months. After monsoon ends, panels often look clean but test 8-12% below their cleaned state. Rainwater is a useful supplement to scheduled cleaning, not a replacement for it. In dust-heavy regions of India, panels need professional cleaning at least 3-4 times per year regardless of rainfall.
Is DIY solar panel cleaning safe or should I hire professionals?
DIY cleaning is possible but carries three significant risks: (1) microfractures from improper pressure or abrasive cloths can void the 25-year panel warranty, (2) falls from rooftops account for most solar-related injuries in India, and (3) cleaning at midday with cold water on hot panels can cause thermal shock damage. Professional cleaning services use deionised water and soft brushes, work in early morning when panels are cool, and carry liability insurance. Cost: ₹300-₹500 per kW per cleaning.
What does professional solar panel cleaning cost in MP?
Professional cleaning in Madhya Pradesh typically costs ₹300-₹500 per kW per visit. A 3 kW residential system runs ₹900-₹1,500 per cleaning. Annual maintenance contracts (AMC) covering 4-6 cleanings plus performance monitoring cost ₹3,000-₹5,000 per year for residential systems. The payback is immediate: a single neglected quarter typically costs more in lost generation than a full year of AMC.